Praveen Kumar K 👋
Senior UX/UI Architect & ✦ AI Agentic Design Strategist with 18+ years of experience across 14+ countries. Expert in HCI, Behavioural UX, Generative AI & Enterprise Design Systems.
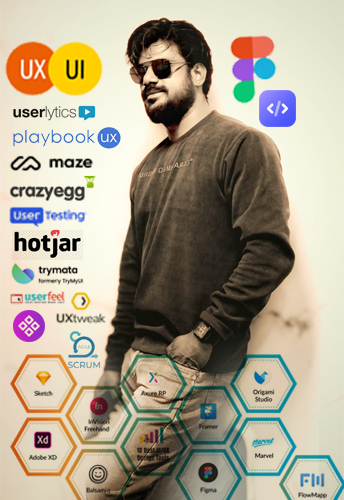
Senior UX/UI Architect & ✦ AI Agentic Design Strategist with 18+ years of experience across 14+ countries. Expert in HCI, Behavioural UX, Generative AI & Enterprise Design Systems.

Modern enterprise platforms demand far more than static CRUD dashboards. With GuideIT Solutions (guideitsol.com), our objective was clear: engineer an intelligent digital ecosystem capable of orchestrating autonomous AI agents, multi-currency payment workflows, and real-time client consultations into one frictionless interface.
As UX/UI Architect, my challenge was bridging the cognitive gap between complex multi-agent reasoning graphs and intuitive user interactions. When a user queries an enterprise knowledge base, they shouldn't encounter raw JSON or detached chatbots; they deserve contextual, responsive micro-interfaces that provide instant clarity.
"Human-centered AI is not about replacing human intent—it is about designing zero-latency feedback loops where user intuition guides autonomous execution seamlessly."
To reduce cognitive friction across 50+ modular components and 30 distinct page workflows, we established strict typographic rhythm, contextual color tokens for task confidence scores, and accessible data visualization dashboards using TanStack Query and Lucide iconography.




Leave a Comment